Forex Trend Analysis Report
Prepared for you on Sunday, January 18, 2026.
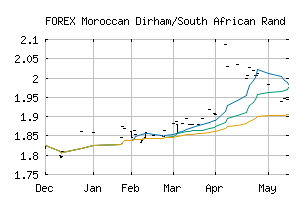
Moroccan Dirham/South African Rand (FOREX:MADZAR)
Long-Term Downtrend (-90) - MADZAR is in a strong downtrend that is likely to continue. While MADZAR is showing intraday strength, it remains in the confines of a bearish trend. Traders should use caution and set stops.
Is it time to buy, sell, or avoid MADZAR?
MarketClub looks at technical strength and momentum to determine if the timing is right for MADZAR.
Learn more about the Trade Triangles and how we make technical analysis as easy as buy and sell.
|
|||||||||||||||
|
|||||||||||||||
MarketClub’s Trade Triangles for MADZAR
![]() The long-term trend has been DOWN since Sep 10th, 2025 at 1.9407961
The long-term trend has been DOWN since Sep 10th, 2025 at 1.9407961
![]() The intermediate-term trend has been DOWN since Aug 31st, 2025 at 1.9511331
The intermediate-term trend has been DOWN since Aug 31st, 2025 at 1.9511331
![]() The short-term trend has been DOWN since Oct 26th, 2025 at 1.8805184
The short-term trend has been DOWN since Oct 26th, 2025 at 1.8805184
Smart Scan Analysis for MADZAR
Based on our trend formula, MADZAR is rated as a -90 on a scale from -100 (Strong Downtrend) to +100 (Strong Uptrend).
| Open | High | Low | Price | Change |
|---|---|---|---|---|
| 1.7713712 | 1.7713712 | 1.7713712 | 1.7713712 | 0.0000000 |
| Prev. Close | Volume | Bid | Ask | Time |
| 1.7838004 | 2026-01-15 21:05:39 |