Forex Trend Analysis Report
Prepared for you on Tuesday, April 14, 2026.
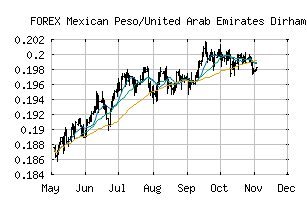
Mexican Peso/United Arab Emirates Dirham (FOREX:MXNAED)
Long-Term Uptrend (+90) - MXNAED is in a strong uptrend that is likely to continue. While MXNAED is showing intraday weakness, it remains in the confines of a bullish trend. Traders should use caution and utilize a stop order.
Is it time to buy, sell, or avoid MXNAED?
MarketClub looks at technical strength and momentum to determine if the timing is right for MXNAED.
Learn more about the Trade Triangles and how we make technical analysis as easy as buy and sell.
|
|||||||||||||||
|
|||||||||||||||
MarketClub’s Trade Triangles for MXNAED
![]() The long-term trend has been UP since Mar 14th, 2025 at 0.18345216
The long-term trend has been UP since Mar 14th, 2025 at 0.18345216
![]() The intermediate-term trend has been UP since Apr 7th, 2026 at 0.20863473
The intermediate-term trend has been UP since Apr 7th, 2026 at 0.20863473
![]() The short-term trend has been UP since Mar 31st, 2026 at 0.20534967
The short-term trend has been UP since Mar 31st, 2026 at 0.20534967
Smart Scan Analysis for MXNAED
Based on our trend formula, MXNAED is rated as a +90 on a scale from -100 (Strong Downtrend) to +100 (Strong Uptrend).
| Open | High | Low | Price | Change |
|---|---|---|---|---|
| 0.21223561 | 0.21352099 | 0.21214747 | 0.21258751 | +0.00035200 |
| Prev. Close | Volume | Bid | Ask | Time |
| 0.21223561 | 2026-04-14 17:45:52 |