Forex Trend Analysis Report
Prepared for you on Sunday, March 29, 2026.
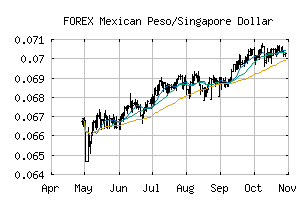
Mexican Peso/Singapore Dollar (FOREX:MXNSGD)
Weak Downtrend (-65) - MXNSGD is showing signs of a strengthening downtrend. Monitor MXNSGD as it may be building momentum to the downside.
Is it time to buy, sell, or avoid MXNSGD?
MarketClub looks at technical strength and momentum to determine if the timing is right for MXNSGD.
Learn more about the Trade Triangles and how we make technical analysis as easy as buy and sell.
|
|||||||||||||||
|
|||||||||||||||
MarketClub’s Trade Triangles for MXNSGD
![]() The long-term trend has been UP since Apr 25th, 2025 at 0.06744172
The long-term trend has been UP since Apr 25th, 2025 at 0.06744172
![]() The intermediate-term trend has been DOWN since Feb 22nd, 2026 at 0.07245292
The intermediate-term trend has been DOWN since Feb 22nd, 2026 at 0.07245292
![]() The short-term trend has been DOWN since Mar 27th, 2026 at 0.07152335
The short-term trend has been DOWN since Mar 27th, 2026 at 0.07152335
Smart Scan Analysis for MXNSGD
Based on our trend formula, MXNSGD is rated as a -70 on a scale from -100 (Strong Downtrend) to +100 (Strong Uptrend).
| Open | High | Low | Price | Change |
|---|---|---|---|---|
| 0.07125750 | 0.07170455 | 0.07103750 | 0.07105336 | -0.00020400 |
| Prev. Close | Volume | Bid | Ask | Time |
| 0.07125750 | 2026-03-29 20:03:46 |