Forex Trend Analysis Report
Prepared for you on Tuesday, April 14, 2026.
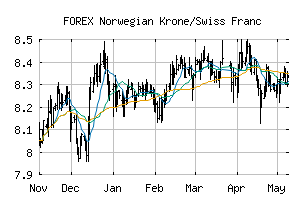
Norwegian Krone/Swiss Franc (FOREX:NOKCHF)
Countertrend Up (+85) - NOKCHF is showing short-term weakness. However, look for the longer-term bullish trend to resume. As always, continue to monitor the trend score and utilize a stop order.
Is it time to buy, sell, or avoid NOKCHF?
MarketClub looks at technical strength and momentum to determine if the timing is right for NOKCHF.
Learn more about the Trade Triangles and how we make technical analysis as easy as buy and sell.
|
|||||||||||||||
|
|||||||||||||||
MarketClub’s Trade Triangles for NOKCHF
![]() The long-term trend has been UP since Jan 29th, 2026 at 8.06000
The long-term trend has been UP since Jan 29th, 2026 at 8.06000
![]() The intermediate-term trend has been UP since Jan 6th, 2026 at 7.90435
The intermediate-term trend has been UP since Jan 6th, 2026 at 7.90435
![]() The short-term trend has been DOWN since Apr 14th, 2026 at 8.26540
The short-term trend has been DOWN since Apr 14th, 2026 at 8.26540
Smart Scan Analysis for NOKCHF
Based on our trend formula, NOKCHF is rated as a +85 on a scale from -100 (Strong Downtrend) to +100 (Strong Uptrend).
| Open | High | Low | Price | Change |
|---|---|---|---|---|
| 8.29100 | 8.30200 | 8.24790 | 8.26855 | -0.02245 |
| Prev. Close | Volume | Bid | Ask | Time |
| 8.29100 | 2026-04-14 19:59:46 |