Forex Trend Analysis Report
Prepared for you on Tuesday, April 14, 2026.
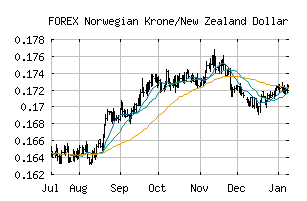
Norwegian Krone/New Zealand Dollar (FOREX:NOKNZD)
Bull Market Weakness (+75) - NOKNZD is showing signs of short-term weakness, but still remains in the confines of a long-term uptrend. Keep an eye on NOKNZD as it may be in the beginning stages of a reversal.
Is it time to buy, sell, or avoid NOKNZD?
MarketClub looks at technical strength and momentum to determine if the timing is right for NOKNZD.
Learn more about the Trade Triangles and how we make technical analysis as easy as buy and sell.
|
|||||||||||||||
|
|||||||||||||||
MarketClub’s Trade Triangles for NOKNZD
![]() The long-term trend has been UP since Dec 11th, 2024 at 0.1552150
The long-term trend has been UP since Dec 11th, 2024 at 0.1552150
![]() The intermediate-term trend has been UP since Feb 10th, 2026 at 0.1732255
The intermediate-term trend has been UP since Feb 10th, 2026 at 0.1732255
![]() The short-term trend has been DOWN since Apr 14th, 2026 at 0.1795165
The short-term trend has been DOWN since Apr 14th, 2026 at 0.1795165
Smart Scan Analysis for NOKNZD
Based on our trend formula, NOKNZD is rated as a +75 on a scale from -100 (Strong Downtrend) to +100 (Strong Uptrend).
| Open | High | Low | Price | Change |
|---|---|---|---|---|
| 0.1804010 | 0.1805025 | 0.1789270 | 0.1792900 | -0.0011110 |
| Prev. Close | Volume | Bid | Ask | Time |
| 0.1804010 | 2026-04-14 18:49:22 |