Forex Trend Analysis Report
Prepared for you on Thursday, March 26, 2026.
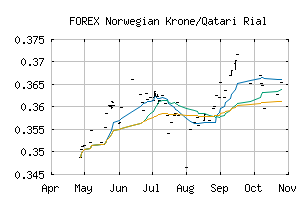
Norwegian Krone/Qatari Rial (FOREX:NOKQAR)
Weak Downtrend (-65) - NOKQAR is showing signs of a strengthening downtrend. Monitor NOKQAR as it may be building momentum to the downside.
Is it time to buy, sell, or avoid NOKQAR?
MarketClub looks at technical strength and momentum to determine if the timing is right for NOKQAR.
Learn more about the Trade Triangles and how we make technical analysis as easy as buy and sell.
|
|||||||||||||||
|
|||||||||||||||
MarketClub’s Trade Triangles for NOKQAR
![]() The long-term trend has been UP since Jan 22nd, 2026 at 0.36709718
The long-term trend has been UP since Jan 22nd, 2026 at 0.36709718
![]() The intermediate-term trend has been DOWN since Mar 11th, 2026 at 0.37990692
The intermediate-term trend has been DOWN since Mar 11th, 2026 at 0.37990692
![]() The short-term trend has been DOWN since Mar 11th, 2026 at 0.37990692
The short-term trend has been DOWN since Mar 11th, 2026 at 0.37990692
Smart Scan Analysis for NOKQAR
Based on our trend formula, NOKQAR is rated as a -70 on a scale from -100 (Strong Downtrend) to +100 (Strong Uptrend).
| Open | High | Low | Price | Change |
|---|---|---|---|---|
| 0.37708087 | 0.37709167 | 0.37699483 | 0.37709167 | +0.00001100 |
| Prev. Close | Volume | Bid | Ask | Time |
| 0.37626642 | 2026-03-12 22:06:00 |