Forex Trend Analysis Report
Prepared for you on Tuesday, April 14, 2026.
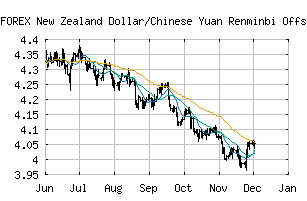
New Zealand Dollar/Chinese Yuan Renminbi Offshore (FOREX:NZDCNH)
Weak Downtrend (-65) - NZDCNH is showing signs of a strengthening downtrend. Monitor NZDCNH as it may be building momentum to the downside.
Is it time to buy, sell, or avoid NZDCNH?
MarketClub looks at technical strength and momentum to determine if the timing is right for NZDCNH.
Learn more about the Trade Triangles and how we make technical analysis as easy as buy and sell.
|
|||||||||||||||
|
|||||||||||||||
MarketClub’s Trade Triangles for NZDCNH
![]() The long-term trend has been DOWN since Mar 26th, 2026 at 3.984240
The long-term trend has been DOWN since Mar 26th, 2026 at 3.984240
![]() The intermediate-term trend has been DOWN since Feb 18th, 2026 at 4.114945
The intermediate-term trend has been DOWN since Feb 18th, 2026 at 4.114945
![]() The short-term trend has been UP since Apr 14th, 2026 at 4.004835
The short-term trend has been UP since Apr 14th, 2026 at 4.004835
Smart Scan Analysis for NZDCNH
Based on our trend formula, NZDCNH is rated as a -65 on a scale from -100 (Strong Downtrend) to +100 (Strong Uptrend).
| Open | High | Low | Price | Change |
|---|---|---|---|---|
| 3.999580 | 4.029470 | 3.997165 | 4.019380 | +0.019800 |
| Prev. Close | Volume | Bid | Ask | Time |
| 3.999580 | 2026-04-14 17:04:55 |