Forex Trend Analysis Report
Prepared for you on Thursday, March 26, 2026.
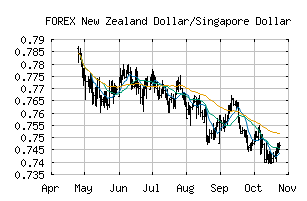
New Zealand Dollar/Singapore Dollar (FOREX:NZDSGD)
Weak Downtrend (-65) - NZDSGD is showing signs of a strengthening downtrend. Monitor NZDSGD as it may be building momentum to the downside.
Is it time to buy, sell, or avoid NZDSGD?
MarketClub looks at technical strength and momentum to determine if the timing is right for NZDSGD.
Learn more about the Trade Triangles and how we make technical analysis as easy as buy and sell.
|
|||||||||||||||
|
|||||||||||||||
MarketClub’s Trade Triangles for NZDSGD
![]() The long-term trend has been UP since Jan 22nd, 2026 at 0.7550115
The long-term trend has been UP since Jan 22nd, 2026 at 0.7550115
![]() The intermediate-term trend has been DOWN since Feb 23rd, 2026 at 0.7538870
The intermediate-term trend has been DOWN since Feb 23rd, 2026 at 0.7538870
![]() The short-term trend has been DOWN since Mar 20th, 2026 at 0.7423573
The short-term trend has been DOWN since Mar 20th, 2026 at 0.7423573
Smart Scan Analysis for NZDSGD
Based on our trend formula, NZDSGD is rated as a -70 on a scale from -100 (Strong Downtrend) to +100 (Strong Uptrend).
| Open | High | Low | Price | Change |
|---|---|---|---|---|
| 0.7442750 | 0.7448552 | 0.7421723 | 0.7425123 | -0.0017630 |
| Prev. Close | Volume | Bid | Ask | Time |
| 0.7442750 | 2026-03-26 04:19:11 |