Forex Trend Analysis Report
Prepared for you on Tuesday, April 14, 2026.
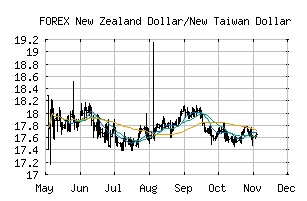
New Zealand Dollar/New Taiwan Dollar (FOREX:NZDTWD)
Weak Uptrend (+65) - NZDTWD is showing signs of weakening momentum to the upside. Monitor NZDTWD as it may be in the beginning stages of a reversal.
Is it time to buy, sell, or avoid NZDTWD?
MarketClub looks at technical strength and momentum to determine if the timing is right for NZDTWD.
Learn more about the Trade Triangles and how we make technical analysis as easy as buy and sell.
|
|||||||||||||||
|
|||||||||||||||
MarketClub’s Trade Triangles for NZDTWD
![]() The long-term trend has been UP since Dec 10th, 2025 at 18.131306
The long-term trend has been UP since Dec 10th, 2025 at 18.131306
![]() The intermediate-term trend has been DOWN since Feb 23rd, 2026 at 18.727321
The intermediate-term trend has been DOWN since Feb 23rd, 2026 at 18.727321
![]() The short-term trend has been UP since Apr 14th, 2026 at 18.620188
The short-term trend has been UP since Apr 14th, 2026 at 18.620188
Smart Scan Analysis for NZDTWD
Based on our trend formula, NZDTWD is rated as a +65 on a scale from -100 (Strong Downtrend) to +100 (Strong Uptrend).
| Open | High | Low | Price | Change |
|---|---|---|---|---|
| 18.577327 | 18.679461 | 18.544505 | 18.603663 | +0.026336 |
| Prev. Close | Volume | Bid | Ask | Time |
| 18.577327 | 2026-04-14 17:38:40 |