Forex Trend Analysis Report
Prepared for you on Tuesday, April 14, 2026.
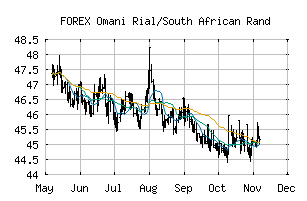
Omani Rial/South African Rand (FOREX:OMRZAR)
Crossroads (-60) - OMRZAR is struggling to move into a solid trend. Beware of choppy markets and consider a sidelines position until a stronger trend is identified.
Is it time to buy, sell, or avoid OMRZAR?
MarketClub looks at technical strength and momentum to determine if the timing is right for OMRZAR.
Learn more about the Trade Triangles and how we make technical analysis as easy as buy and sell.
|
|||||||||||||||
|
|||||||||||||||
MarketClub’s Trade Triangles for OMRZAR
![]() The long-term trend has been UP since Mar 20th, 2026 at 44.820919
The long-term trend has been UP since Mar 20th, 2026 at 44.820919
![]() The intermediate-term trend has been DOWN since Apr 7th, 2026 at 43.130115
The intermediate-term trend has been DOWN since Apr 7th, 2026 at 43.130115
![]() The short-term trend has been DOWN since Apr 14th, 2026 at 42.472697
The short-term trend has been DOWN since Apr 14th, 2026 at 42.472697
Smart Scan Analysis for OMRZAR
Based on our trend formula, OMRZAR is rated as a -60 on a scale from -100 (Strong Downtrend) to +100 (Strong Uptrend).
| Open | High | Low | Price | Change |
|---|---|---|---|---|
| 42.667711 | 42.713654 | 42.424378 | 42.518653 | -0.149058 |
| Prev. Close | Volume | Bid | Ask | Time |
| 42.667711 | 2026-04-14 17:45:39 |