Forex Trend Analysis Report
Prepared for you on Thursday, April 2, 2026.
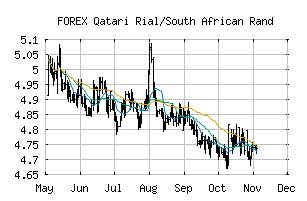
Qatari Rial/South African Rand (FOREX:QARZAR)
Countertrend Up (+85) - QARZAR is showing short-term weakness. However, look for the longer-term bullish trend to resume. As always, continue to monitor the trend score and utilize a stop order.
Is it time to buy, sell, or avoid QARZAR?
MarketClub looks at technical strength and momentum to determine if the timing is right for QARZAR.
Learn more about the Trade Triangles and how we make technical analysis as easy as buy and sell.
|
|||||||||||||||
|
|||||||||||||||
MarketClub’s Trade Triangles for QARZAR
![]() The long-term trend has been UP since Mar 27th, 2026 at 4.7207069
The long-term trend has been UP since Mar 27th, 2026 at 4.7207069
![]() The intermediate-term trend has been UP since Mar 3rd, 2026 at 4.4464812
The intermediate-term trend has been UP since Mar 3rd, 2026 at 4.4464812
![]() The short-term trend has been DOWN since Mar 31st, 2026 at 4.6736615
The short-term trend has been DOWN since Mar 31st, 2026 at 4.6736615
Smart Scan Analysis for QARZAR
Based on our trend formula, QARZAR is rated as a +85 on a scale from -100 (Strong Downtrend) to +100 (Strong Uptrend).
| Open | High | Low | Price | Change |
|---|---|---|---|---|
| 4.6341140 | 4.6352997 | 4.6270209 | 4.6333255 | -0.0007890 |
| Prev. Close | Volume | Bid | Ask | Time |
| 4.6341140 | 2026-04-02 01:09:04 |