Forex Trend Analysis Report
Prepared for you on Friday, April 3, 2026.
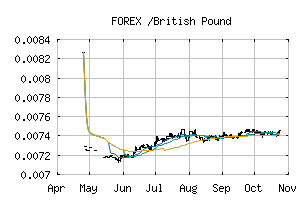
/British Pound (FOREX:RSDGBP)
Crossroads (+60) - RSDGBP is struggling to move into a solid trend. Beware of choppy markets and consider a sidelines position until a stronger trend is identified.
Is it time to buy, sell, or avoid RSDGBP?
MarketClub looks at technical strength and momentum to determine if the timing is right for RSDGBP.
Learn more about the Trade Triangles and how we make technical analysis as easy as buy and sell.
|
|||||||||||||||
|
|||||||||||||||
MarketClub’s Trade Triangles for RSDGBP
![]() The long-term trend has been DOWN since Jan 5th, 2026 at 0.00738863
The long-term trend has been DOWN since Jan 5th, 2026 at 0.00738863
![]() The intermediate-term trend has been UP since Mar 30th, 2026 at 0.00739189
The intermediate-term trend has been UP since Mar 30th, 2026 at 0.00739189
![]() The short-term trend has been UP since Mar 20th, 2026 at 0.00736384
The short-term trend has been UP since Mar 20th, 2026 at 0.00736384
Smart Scan Analysis for RSDGBP
Based on our trend formula, RSDGBP is rated as a +60 on a scale from -100 (Strong Downtrend) to +100 (Strong Uptrend).
| Open | High | Low | Price | Change |
|---|---|---|---|---|
| 0.00743093 | 0.00744088 | 0.00742647 | 0.00743411 | +0.00000300 |
| Prev. Close | Volume | Bid | Ask | Time |
| 0.00743093 | 2026-04-02 17:27:54 |