Forex Trend Analysis Report
Prepared for you on Wednesday, March 25, 2026.
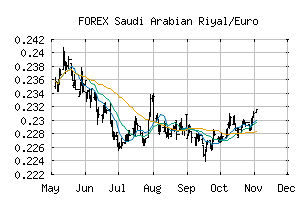
Saudi Arabian Riyal/Euro (FOREX:SAREUR)
Countertrend Up (+85) - SAREUR is showing short-term weakness. However, look for the longer-term bullish trend to resume. As always, continue to monitor the trend score and utilize a stop order.
Is it time to buy, sell, or avoid SAREUR?
MarketClub looks at technical strength and momentum to determine if the timing is right for SAREUR.
Learn more about the Trade Triangles and how we make technical analysis as easy as buy and sell.
|
|||||||||||||||
|
|||||||||||||||
MarketClub’s Trade Triangles for SAREUR
![]() The long-term trend has been UP since Mar 3rd, 2026 at 0.23045753
The long-term trend has been UP since Mar 3rd, 2026 at 0.23045753
![]() The intermediate-term trend has been UP since Feb 19th, 2026 at 0.22642906
The intermediate-term trend has been UP since Feb 19th, 2026 at 0.22642906
![]() The short-term trend has been DOWN since Mar 18th, 2026 at 0.23069146
The short-term trend has been DOWN since Mar 18th, 2026 at 0.23069146
Smart Scan Analysis for SAREUR
Based on our trend formula, SAREUR is rated as a +85 on a scale from -100 (Strong Downtrend) to +100 (Strong Uptrend).
| Open | High | Low | Price | Change |
|---|---|---|---|---|
| 0.22969527 | 0.23063825 | 0.22959507 | 0.23062229 | +0.00092700 |
| Prev. Close | Volume | Bid | Ask | Time |
| 0.22969527 | 2026-03-25 17:01:37 |