Forex Trend Analysis Report
Prepared for you on Tuesday, April 14, 2026.
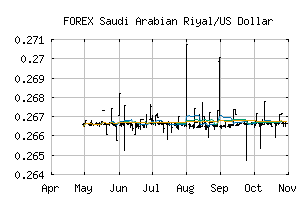
Saudi Arabian Riyal/US Dollar (FOREX:SARUSD)
Weak Uptrend (+65) - SARUSD is showing signs of weakening momentum to the upside. Monitor SARUSD as it may be in the beginning stages of a reversal.
Is it time to buy, sell, or avoid SARUSD?
MarketClub looks at technical strength and momentum to determine if the timing is right for SARUSD.
Learn more about the Trade Triangles and how we make technical analysis as easy as buy and sell.
|
|||||||||||||||
|
|||||||||||||||
MarketClub’s Trade Triangles for SARUSD
![]() The long-term trend has been UP since Feb 27th, 2026 at 0.26786750
The long-term trend has been UP since Feb 27th, 2026 at 0.26786750
![]() The intermediate-term trend has been DOWN since Mar 2nd, 2026 at 0.26549613
The intermediate-term trend has been DOWN since Mar 2nd, 2026 at 0.26549613
![]() The short-term trend has been UP since Apr 12th, 2026 at 0.26659335
The short-term trend has been UP since Apr 12th, 2026 at 0.26659335
Smart Scan Analysis for SARUSD
Based on our trend formula, SARUSD is rated as a +65 on a scale from -100 (Strong Downtrend) to +100 (Strong Uptrend).
| Open | High | Low | Price | Change |
|---|---|---|---|---|
| 0.26645903 | 0.26656266 | 0.26645502 | 0.26654610 | +0.00008700 |
| Prev. Close | Volume | Bid | Ask | Time |
| 0.26645903 | 2026-04-14 18:09:04 |