Forex Trend Analysis Report
Prepared for you on Tuesday, April 14, 2026.
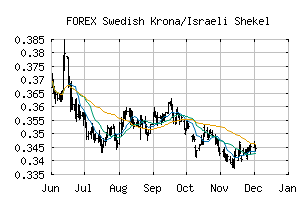
Swedish Krona/Israeli Shekel (FOREX:SEKILS)
Strong Downtrend (-100) - SEKILS is in a strong downtrend that is likely to continue. With short-term, intermediate, and long-term bearish momentum, SEKILS continues to fall. Traders should use caution and set stops.
Is it time to buy, sell, or avoid SEKILS?
MarketClub looks at technical strength and momentum to determine if the timing is right for SEKILS.
Learn more about the Trade Triangles and how we make technical analysis as easy as buy and sell.
|
|||||||||||||||
|
|||||||||||||||
MarketClub’s Trade Triangles for SEKILS
![]() The long-term trend has been DOWN since Jul 2nd, 2025 at 0.35327270
The long-term trend has been DOWN since Jul 2nd, 2025 at 0.35327270
![]() The intermediate-term trend has been DOWN since Feb 18th, 2026 at 0.34307454
The intermediate-term trend has been DOWN since Feb 18th, 2026 at 0.34307454
![]() The short-term trend has been DOWN since Apr 7th, 2026 at 0.33027473
The short-term trend has been DOWN since Apr 7th, 2026 at 0.33027473
Smart Scan Analysis for SEKILS
Based on our trend formula, SEKILS is rated as a -100 on a scale from -100 (Strong Downtrend) to +100 (Strong Uptrend).
| Open | High | Low | Price | Change |
|---|---|---|---|---|
| 0.33043735 | 0.33180615 | 0.32772023 | 0.32823543 | -0.00220200 |
| Prev. Close | Volume | Bid | Ask | Time |
| 0.33043735 | 2026-04-14 11:06:47 |