Forex Trend Analysis Report
Prepared for you on Tuesday, April 14, 2026.
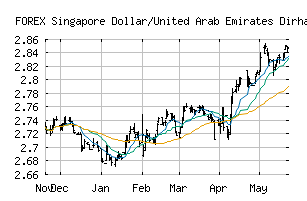
Singapore Dollar/United Arab Emirates Dirham (FOREX:SGDAED)
Long-Term Uptrend (+90) - SGDAED is in a strong uptrend that is likely to continue. While SGDAED is showing intraday weakness, it remains in the confines of a bullish trend. Traders should use caution and utilize a stop order.
Is it time to buy, sell, or avoid SGDAED?
MarketClub looks at technical strength and momentum to determine if the timing is right for SGDAED.
Learn more about the Trade Triangles and how we make technical analysis as easy as buy and sell.
|
|||||||||||||||
|
|||||||||||||||
MarketClub’s Trade Triangles for SGDAED
![]() The long-term trend has been UP since Jan 5th, 2026 at 2.8633616
The long-term trend has been UP since Jan 5th, 2026 at 2.8633616
![]() The intermediate-term trend has been UP since Apr 8th, 2026 at 2.8832210
The intermediate-term trend has been UP since Apr 8th, 2026 at 2.8832210
![]() The short-term trend has been UP since Apr 1st, 2026 at 2.8572873
The short-term trend has been UP since Apr 1st, 2026 at 2.8572873
Smart Scan Analysis for SGDAED
Based on our trend formula, SGDAED is rated as a +90 on a scale from -100 (Strong Downtrend) to +100 (Strong Uptrend).
| Open | High | Low | Price | Change |
|---|---|---|---|---|
| 2.8844164 | 2.8913075 | 2.8833092 | 2.8892750 | +0.0048590 |
| Prev. Close | Volume | Bid | Ask | Time |
| 2.8844164 | 2026-04-14 12:56:52 |