Forex Trend Analysis Report
Prepared for you on Tuesday, April 14, 2026.
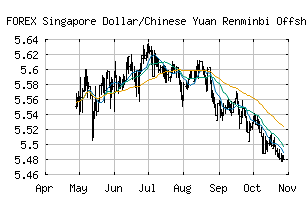
Singapore Dollar/Chinese Yuan Renminbi Offshore (FOREX:SGDCNH)
Strong Downtrend (-100) - SGDCNH is in a strong downtrend that is likely to continue. With short-term, intermediate, and long-term bearish momentum, SGDCNH continues to fall. Traders should use caution and set stops.
Is it time to buy, sell, or avoid SGDCNH?
MarketClub looks at technical strength and momentum to determine if the timing is right for SGDCNH.
Learn more about the Trade Triangles and how we make technical analysis as easy as buy and sell.
|
|||||||||||||||
|
|||||||||||||||
MarketClub’s Trade Triangles for SGDCNH
![]() The long-term trend has been DOWN since Sep 19th, 2025 at 5.5318909
The long-term trend has been DOWN since Sep 19th, 2025 at 5.5318909
![]() The intermediate-term trend has been DOWN since Feb 18th, 2026 at 5.4377977
The intermediate-term trend has been DOWN since Feb 18th, 2026 at 5.4377977
![]() The short-term trend has been DOWN since Apr 12th, 2026 at 5.3537603
The short-term trend has been DOWN since Apr 12th, 2026 at 5.3537603
Smart Scan Analysis for SGDCNH
Based on our trend formula, SGDCNH is rated as a -100 on a scale from -100 (Strong Downtrend) to +100 (Strong Uptrend).
| Open | High | Low | Price | Change |
|---|---|---|---|---|
| 5.3521306 | 5.3593598 | 5.3516100 | 5.3566156 | +0.0044850 |
| Prev. Close | Volume | Bid | Ask | Time |
| 5.3521306 | 2026-04-14 17:42:33 |