Forex Trend Analysis Report
Prepared for you on Wednesday, March 25, 2026.
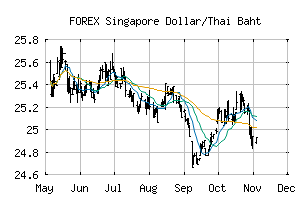
Singapore Dollar/Thai Baht (FOREX:SGDTHB)
Strong Uptrend (+100) - SGDTHB is in a strong uptrend that is likely to continue. With short-term, intermediate, and long-term bullish momentum, SGDTHB continues to climb. Traders should protect gains and look for a change in score to suggest a slow down in momentum.
Is it time to buy, sell, or avoid SGDTHB?
MarketClub looks at technical strength and momentum to determine if the timing is right for SGDTHB.
Learn more about the Trade Triangles and how we make technical analysis as easy as buy and sell.
|
|||||||||||||||
|
|||||||||||||||
MarketClub’s Trade Triangles for SGDTHB
![]() The long-term trend has been UP since Mar 9th, 2026 at 24.975528
The long-term trend has been UP since Mar 9th, 2026 at 24.975528
![]() The intermediate-term trend has been UP since Mar 1st, 2026 at 24.797191
The intermediate-term trend has been UP since Mar 1st, 2026 at 24.797191
![]() The short-term trend has been UP since Mar 1st, 2026 at 24.620918
The short-term trend has been UP since Mar 1st, 2026 at 24.620918
Smart Scan Analysis for SGDTHB
Based on our trend formula, SGDTHB is rated as a +100 on a scale from -100 (Strong Downtrend) to +100 (Strong Uptrend).
| Open | High | Low | Price | Change |
|---|---|---|---|---|
| 25.537407 | 25.610032 | 25.432303 | 25.606611 | +0.069204 |
| Prev. Close | Volume | Bid | Ask | Time |
| 25.537407 | 2026-03-25 17:01:37 |