Forex Trend Analysis Report
Prepared for you on Thursday, April 2, 2026.
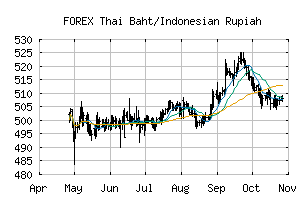
Thai Baht/Indonesian Rupiah (FOREX:THBIDR)
Countertrend Down (-85) - THBIDR is showing short-term strength. However, look for the longer-term bearish trend to resume. As always, continue to monitor the trend score and set stops.
Is it time to buy, sell, or avoid THBIDR?
MarketClub looks at technical strength and momentum to determine if the timing is right for THBIDR.
Learn more about the Trade Triangles and how we make technical analysis as easy as buy and sell.
|
|||||||||||||||
|
|||||||||||||||
MarketClub’s Trade Triangles for THBIDR
![]() The long-term trend has been DOWN since Mar 16th, 2026 at 517.95175
The long-term trend has been DOWN since Mar 16th, 2026 at 517.95175
![]() The intermediate-term trend has been DOWN since Mar 3rd, 2026 at 532.96500
The intermediate-term trend has been DOWN since Mar 3rd, 2026 at 532.96500
![]() The short-term trend has been UP since Mar 27th, 2026 at 521.36252
The short-term trend has been UP since Mar 27th, 2026 at 521.36252
Smart Scan Analysis for THBIDR
Based on our trend formula, THBIDR is rated as a -85 on a scale from -100 (Strong Downtrend) to +100 (Strong Uptrend).
| Open | High | Low | Price | Change |
|---|---|---|---|---|
| 519.68072 | 520.79225 | 518.53156 | 518.93744 | -0.74328 |
| Prev. Close | Volume | Bid | Ask | Time |
| 519.68072 | 2026-04-02 05:59:30 |