Forex Trend Analysis Report
Prepared for you on Wednesday, March 25, 2026.
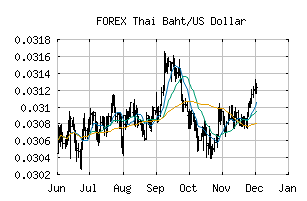
Thai Baht/US Dollar (FOREX:THBUSD)
Strong Downtrend (-100) - THBUSD is in a strong downtrend that is likely to continue. With short-term, intermediate, and long-term bearish momentum, THBUSD continues to fall. Traders should use caution and set stops.
Is it time to buy, sell, or avoid THBUSD?
MarketClub looks at technical strength and momentum to determine if the timing is right for THBUSD.
Learn more about the Trade Triangles and how we make technical analysis as easy as buy and sell.
|
|||||||||||||||
|
|||||||||||||||
MarketClub’s Trade Triangles for THBUSD
![]() The long-term trend has been DOWN since Mar 8th, 2026 at 0.03116236
The long-term trend has been DOWN since Mar 8th, 2026 at 0.03116236
![]() The intermediate-term trend has been DOWN since Jan 30th, 2026 at 0.03168568
The intermediate-term trend has been DOWN since Jan 30th, 2026 at 0.03168568
![]() The short-term trend has been DOWN since Mar 23rd, 2026 at 0.03026314
The short-term trend has been DOWN since Mar 23rd, 2026 at 0.03026314
Smart Scan Analysis for THBUSD
Based on our trend formula, THBUSD is rated as a -100 on a scale from -100 (Strong Downtrend) to +100 (Strong Uptrend).
| Open | High | Low | Price | Change |
|---|---|---|---|---|
| 0.03060912 | 0.03078249 | 0.03045393 | 0.03048781 | -0.00012100 |
| Prev. Close | Volume | Bid | Ask | Time |
| 0.03060912 | 2026-03-25 17:02:33 |