Forex Trend Analysis Report
Prepared for you on Sunday, March 29, 2026.
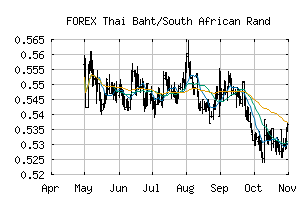
Thai Baht/South African Rand (FOREX:THBZAR)
Crossroads (+60) - THBZAR is struggling to move into a solid trend. Beware of choppy markets and consider a sidelines position until a stronger trend is identified.
Is it time to buy, sell, or avoid THBZAR?
MarketClub looks at technical strength and momentum to determine if the timing is right for THBZAR.
Learn more about the Trade Triangles and how we make technical analysis as easy as buy and sell.
|
|||||||||||||||
|
|||||||||||||||
MarketClub’s Trade Triangles for THBZAR
![]() The long-term trend has been DOWN since Aug 22nd, 2025 at 0.53909286
The long-term trend has been DOWN since Aug 22nd, 2025 at 0.53909286
![]() The intermediate-term trend has been UP since Mar 2nd, 2026 at 0.51969182
The intermediate-term trend has been UP since Mar 2nd, 2026 at 0.51969182
![]() The short-term trend has been UP since Mar 24th, 2026 at 0.52465681
The short-term trend has been UP since Mar 24th, 2026 at 0.52465681
Smart Scan Analysis for THBZAR
Based on our trend formula, THBZAR is rated as a +60 on a scale from -100 (Strong Downtrend) to +100 (Strong Uptrend).
| Open | High | Low | Price | Change |
|---|---|---|---|---|
| 0.52026435 | 0.52033169 | 0.51964639 | 0.51998283 | -0.00028200 |
| Prev. Close | Volume | Bid | Ask | Time |
| 0.52026435 | 2026-03-29 16:07:00 |