Forex Trend Analysis Report
Prepared for you on Tuesday, April 14, 2026.
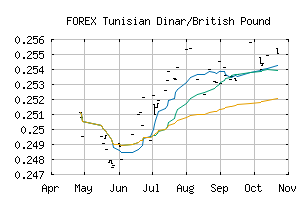
Tunisian Dinar/British Pound (FOREX:TNDGBP)
Long-Term Downtrend (-90) - TNDGBP is in a strong downtrend that is likely to continue. While TNDGBP is showing intraday strength, it remains in the confines of a bearish trend. Traders should use caution and set stops.
Is it time to buy, sell, or avoid TNDGBP?
MarketClub looks at technical strength and momentum to determine if the timing is right for TNDGBP.
Learn more about the Trade Triangles and how we make technical analysis as easy as buy and sell.
|
|||||||||||||||
|
|||||||||||||||
MarketClub’s Trade Triangles for TNDGBP
![]() The long-term trend has been DOWN since Jan 13th, 2026 at 0.25402454
The long-term trend has been DOWN since Jan 13th, 2026 at 0.25402454
![]() The intermediate-term trend has been DOWN since Apr 10th, 2026 at 0.25513116
The intermediate-term trend has been DOWN since Apr 10th, 2026 at 0.25513116
![]() The short-term trend has been DOWN since Apr 10th, 2026 at 0.25513116
The short-term trend has been DOWN since Apr 10th, 2026 at 0.25513116
Smart Scan Analysis for TNDGBP
Based on our trend formula, TNDGBP is rated as a -90 on a scale from -100 (Strong Downtrend) to +100 (Strong Uptrend).
| Open | High | Low | Price | Change |
|---|---|---|---|---|
| 0.25470375 | 0.25470375 | 0.25470375 | 0.25470375 | 0.00000000 |
| Prev. Close | Volume | Bid | Ask | Time |
| 0.25511330 | 2026-04-11 05:21:17 |