Forex Trend Analysis Report
Prepared for you on Wednesday, March 25, 2026.
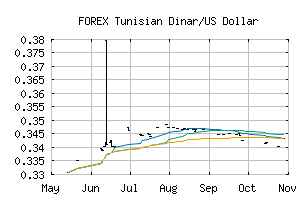
Tunisian Dinar/US Dollar (FOREX:TNDUSD)
Weak Downtrend (-65) - TNDUSD is showing signs of a strengthening downtrend. Monitor TNDUSD as it may be building momentum to the downside.
Is it time to buy, sell, or avoid TNDUSD?
MarketClub looks at technical strength and momentum to determine if the timing is right for TNDUSD.
Learn more about the Trade Triangles and how we make technical analysis as easy as buy and sell.
|
|||||||||||||||
|
|||||||||||||||
MarketClub’s Trade Triangles for TNDUSD
![]() The long-term trend has been UP since Jan 5th, 2026 at 0.34656914
The long-term trend has been UP since Jan 5th, 2026 at 0.34656914
![]() The intermediate-term trend has been DOWN since Feb 25th, 2026 at 0.35118552
The intermediate-term trend has been DOWN since Feb 25th, 2026 at 0.35118552
![]() The short-term trend has been DOWN since Feb 25th, 2026 at 0.35118552
The short-term trend has been DOWN since Feb 25th, 2026 at 0.35118552
Smart Scan Analysis for TNDUSD
Based on our trend formula, TNDUSD is rated as a -70 on a scale from -100 (Strong Downtrend) to +100 (Strong Uptrend).
| Open | High | Low | Price | Change |
|---|---|---|---|---|
| 0.34423412 | 0.34423412 | 0.34423412 | 0.34423412 | 0.00000000 |
| Prev. Close | Volume | Bid | Ask | Time |
| 0.34423412 | 2026-03-24 10:55:29 |