Forex Trend Analysis Report
Prepared for you on Tuesday, April 14, 2026.
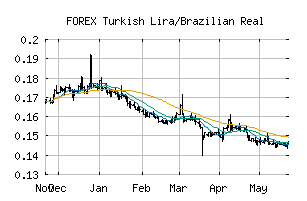
Turkish Lira/Brazilian Real (FOREX:TRYBRL)
Countertrend Down (-85) - TRYBRL is showing short-term strength. However, look for the longer-term bearish trend to resume. As always, continue to monitor the trend score and set stops.
Is it time to buy, sell, or avoid TRYBRL?
MarketClub looks at technical strength and momentum to determine if the timing is right for TRYBRL.
Learn more about the Trade Triangles and how we make technical analysis as easy as buy and sell.
|
|||||||||||||||
|
|||||||||||||||
MarketClub’s Trade Triangles for TRYBRL
![]() The long-term trend has been DOWN since Feb 3rd, 2025 at 0.16209107
The long-term trend has been DOWN since Feb 3rd, 2025 at 0.16209107
![]() The intermediate-term trend has been DOWN since Mar 31st, 2026 at 0.11656828
The intermediate-term trend has been DOWN since Mar 31st, 2026 at 0.11656828
![]() The short-term trend has been UP since Apr 8th, 2026 at 0.11599758
The short-term trend has been UP since Apr 8th, 2026 at 0.11599758
Smart Scan Analysis for TRYBRL
Based on our trend formula, TRYBRL is rated as a -85 on a scale from -100 (Strong Downtrend) to +100 (Strong Uptrend).
| Open | High | Low | Price | Change |
|---|---|---|---|---|
| 0.11163834 | 0.11200571 | 0.11107958 | 0.11182296 | +0.00018500 |
| Prev. Close | Volume | Bid | Ask | Time |
| 0.11163834 | 2026-04-14 17:35:38 |