Forex Trend Analysis Report
Prepared for you on Tuesday, April 14, 2026.
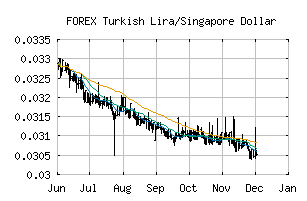
Turkish Lira/Singapore Dollar (FOREX:TRYSGD)
Long-Term Downtrend (-90) - TRYSGD is in a strong downtrend that is likely to continue. While TRYSGD is showing intraday strength, it remains in the confines of a bearish trend. Traders should use caution and set stops.
Is it time to buy, sell, or avoid TRYSGD?
MarketClub looks at technical strength and momentum to determine if the timing is right for TRYSGD.
Learn more about the Trade Triangles and how we make technical analysis as easy as buy and sell.
|
|||||||||||||||
|
|||||||||||||||
MarketClub’s Trade Triangles for TRYSGD
![]() The long-term trend has been DOWN since Feb 4th, 2025 at 0.03753987
The long-term trend has been DOWN since Feb 4th, 2025 at 0.03753987
![]() The intermediate-term trend has been DOWN since Apr 1st, 2026 at 0.02866827
The intermediate-term trend has been DOWN since Apr 1st, 2026 at 0.02866827
![]() The short-term trend has been DOWN since Mar 31st, 2026 at 0.02883715
The short-term trend has been DOWN since Mar 31st, 2026 at 0.02883715
Smart Scan Analysis for TRYSGD
Based on our trend formula, TRYSGD is rated as a -90 on a scale from -100 (Strong Downtrend) to +100 (Strong Uptrend).
| Open | High | Low | Price | Change |
|---|---|---|---|---|
| 0.02845737 | 0.02849000 | 0.02819906 | 0.02840557 | -0.00005200 |
| Prev. Close | Volume | Bid | Ask | Time |
| 0.02845737 | 2026-04-14 17:41:08 |