Forex Trend Analysis Report
Prepared for you on Tuesday, April 14, 2026.
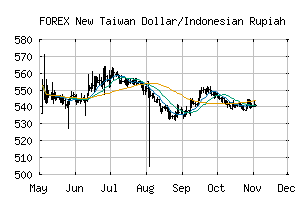
New Taiwan Dollar/Indonesian Rupiah (FOREX:TWDIDR)
Strong Uptrend (+100) - TWDIDR is in a strong uptrend that is likely to continue. With short-term, intermediate, and long-term bullish momentum, TWDIDR continues to climb. Traders should protect gains and look for a change in score to suggest a slow down in momentum.
Is it time to buy, sell, or avoid TWDIDR?
MarketClub looks at technical strength and momentum to determine if the timing is right for TWDIDR.
Learn more about the Trade Triangles and how we make technical analysis as easy as buy and sell.
|
|||||||||||||||
|
|||||||||||||||
MarketClub’s Trade Triangles for TWDIDR
![]() The long-term trend has been UP since Apr 9th, 2026 at 539.95594
The long-term trend has been UP since Apr 9th, 2026 at 539.95594
![]() The intermediate-term trend has been UP since Apr 5th, 2026 at 533.97997
The intermediate-term trend has been UP since Apr 5th, 2026 at 533.97997
![]() The short-term trend has been UP since Apr 5th, 2026 at 533.52222
The short-term trend has been UP since Apr 5th, 2026 at 533.52222
Smart Scan Analysis for TWDIDR
Based on our trend formula, TWDIDR is rated as a +100 on a scale from -100 (Strong Downtrend) to +100 (Strong Uptrend).
| Open | High | Low | Price | Change |
|---|---|---|---|---|
| 541.40882 | 543.47619 | 540.84679 | 543.44620 | +2.03738 |
| Prev. Close | Volume | Bid | Ask | Time |
| 541.40882 | 2026-04-14 17:18:35 |