Forex Trend Analysis Report
Prepared for you on Sunday, March 29, 2026.
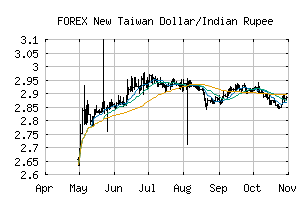
New Taiwan Dollar/Indian Rupee (FOREX:TWDINR)
Long-Term Uptrend (+90) - TWDINR is in a strong uptrend that is likely to continue. While TWDINR is showing intraday weakness, it remains in the confines of a bullish trend. Traders should use caution and utilize a stop order.
Is it time to buy, sell, or avoid TWDINR?
MarketClub looks at technical strength and momentum to determine if the timing is right for TWDINR.
Learn more about the Trade Triangles and how we make technical analysis as easy as buy and sell.
|
|||||||||||||||
|
|||||||||||||||
MarketClub’s Trade Triangles for TWDINR
![]() The long-term trend has been UP since Mar 24th, 2026 at 2.9446492
The long-term trend has been UP since Mar 24th, 2026 at 2.9446492
![]() The intermediate-term trend has been UP since Mar 16th, 2026 at 2.9197445
The intermediate-term trend has been UP since Mar 16th, 2026 at 2.9197445
![]() The short-term trend has been UP since Mar 16th, 2026 at 2.9153408
The short-term trend has been UP since Mar 16th, 2026 at 2.9153408
Smart Scan Analysis for TWDINR
Based on our trend formula, TWDINR is rated as a +90 on a scale from -100 (Strong Downtrend) to +100 (Strong Uptrend).
| Open | High | Low | Price | Change |
|---|---|---|---|---|
| 2.9580799 | 2.9580799 | 2.9580799 | 2.9580799 | 0.0000000 |
| Prev. Close | Volume | Bid | Ask | Time |
| 2.9580799 | 2026-03-28 15:15:26 |