Forex Trend Analysis Report
Prepared for you on Friday, March 27, 2026.
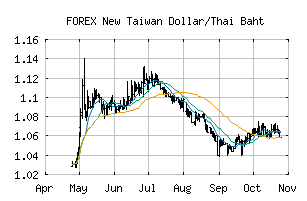
New Taiwan Dollar/Thai Baht (FOREX:TWDTHB)
Long-Term Uptrend (+90) - TWDTHB is in a strong uptrend that is likely to continue. While TWDTHB is showing intraday weakness, it remains in the confines of a bullish trend. Traders should use caution and utilize a stop order.
Is it time to buy, sell, or avoid TWDTHB?
MarketClub looks at technical strength and momentum to determine if the timing is right for TWDTHB.
Learn more about the Trade Triangles and how we make technical analysis as easy as buy and sell.
|
|||||||||||||||
|
|||||||||||||||
MarketClub’s Trade Triangles for TWDTHB
![]() The long-term trend has been UP since Mar 18th, 2026 at 1.0249733
The long-term trend has been UP since Mar 18th, 2026 at 1.0249733
![]() The intermediate-term trend has been UP since Mar 3rd, 2026 at 0.9997174
The intermediate-term trend has been UP since Mar 3rd, 2026 at 0.9997174
![]() The short-term trend has been UP since Mar 26th, 2026 at 1.0297372
The short-term trend has been UP since Mar 26th, 2026 at 1.0297372
Smart Scan Analysis for TWDTHB
Based on our trend formula, TWDTHB is rated as a +90 on a scale from -100 (Strong Downtrend) to +100 (Strong Uptrend).
| Open | High | Low | Price | Change |
|---|---|---|---|---|
| 1.0292080 | 1.0311941 | 1.0239350 | 1.0272380 | -0.0019700 |
| Prev. Close | Volume | Bid | Ask | Time |
| 1.0292080 | 2026-03-27 12:23:12 |