Forex Trend Analysis Report
Prepared for you on Tuesday, April 14, 2026.
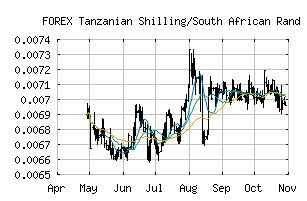
Tanzanian Shilling/South African Rand (FOREX:TZSZAR)
Strong Downtrend (-100) - TZSZAR is in a strong downtrend that is likely to continue. With short-term, intermediate, and long-term bearish momentum, TZSZAR continues to fall. Traders should use caution and set stops.
Is it time to buy, sell, or avoid TZSZAR?
MarketClub looks at technical strength and momentum to determine if the timing is right for TZSZAR.
Learn more about the Trade Triangles and how we make technical analysis as easy as buy and sell.
|
|||||||||||||||
|
|||||||||||||||
MarketClub’s Trade Triangles for TZSZAR
![]() The long-term trend has been DOWN since Dec 11th, 2025 at 0.00688948
The long-term trend has been DOWN since Dec 11th, 2025 at 0.00688948
![]() The intermediate-term trend has been DOWN since Apr 7th, 2026 at 0.00635642
The intermediate-term trend has been DOWN since Apr 7th, 2026 at 0.00635642
![]() The short-term trend has been DOWN since Apr 14th, 2026 at 0.00626904
The short-term trend has been DOWN since Apr 14th, 2026 at 0.00626904
Smart Scan Analysis for TZSZAR
Based on our trend formula, TZSZAR is rated as a -100 on a scale from -100 (Strong Downtrend) to +100 (Strong Uptrend).
| Open | High | Low | Price | Change |
|---|---|---|---|---|
| 0.00630461 | 0.00631114 | 0.00625914 | 0.00626704 | -0.00003800 |
| Prev. Close | Volume | Bid | Ask | Time |
| 0.00630461 | 2026-04-14 19:54:49 |