Forex Trend Analysis Report
Prepared for you on Tuesday, April 14, 2026.
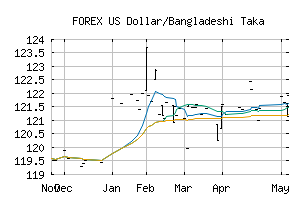
US Dollar/Bangladeshi Taka (FOREX:USDBDT)
Countertrend Up (+85) - USDBDT is showing short-term weakness. However, look for the longer-term bullish trend to resume. As always, continue to monitor the trend score and utilize a stop order.
Is it time to buy, sell, or avoid USDBDT?
MarketClub looks at technical strength and momentum to determine if the timing is right for USDBDT.
Learn more about the Trade Triangles and how we make technical analysis as easy as buy and sell.
|
|||||||||||||||
|
|||||||||||||||
MarketClub’s Trade Triangles for USDBDT
![]() The long-term trend has been UP since Jan 15th, 2026 at 122.44880
The long-term trend has been UP since Jan 15th, 2026 at 122.44880
![]() The intermediate-term trend has been UP since Mar 11th, 2026 at 122.42538
The intermediate-term trend has been UP since Mar 11th, 2026 at 122.42538
![]() The short-term trend has been UP since Mar 3rd, 2026 at 122.27045
The short-term trend has been UP since Mar 3rd, 2026 at 122.27045
Smart Scan Analysis for USDBDT
Based on our trend formula, USDBDT is rated as a +80 on a scale from -100 (Strong Downtrend) to +100 (Strong Uptrend).
| Open | High | Low | Price | Change |
|---|---|---|---|---|
| 122.67167 | 122.67167 | 122.67167 | 122.67167 | 0.00000 |
| Prev. Close | Volume | Bid | Ask | Time |
| 122.92766 | 2026-04-11 05:21:18 |