Forex Trend Analysis Report
Prepared for you on Tuesday, April 14, 2026.
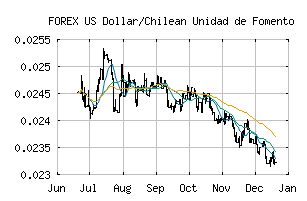
US Dollar/Chilean Unidad de Fomento (FOREX:USDCLF)
Strong Downtrend (-100) - USDCLF is in a strong downtrend that is likely to continue. With short-term, intermediate, and long-term bearish momentum, USDCLF continues to fall. Traders should use caution and set stops.
Is it time to buy, sell, or avoid USDCLF?
MarketClub looks at technical strength and momentum to determine if the timing is right for USDCLF.
Learn more about the Trade Triangles and how we make technical analysis as easy as buy and sell.
|
|||||||||||||||
|
|||||||||||||||
MarketClub’s Trade Triangles for USDCLF
![]() The long-term trend has been DOWN since Feb 4th, 2025 at 0.03449708
The long-term trend has been DOWN since Feb 4th, 2025 at 0.03449708
![]() The intermediate-term trend has been DOWN since Apr 8th, 2026 at 0.02292356
The intermediate-term trend has been DOWN since Apr 8th, 2026 at 0.02292356
![]() The short-term trend has been DOWN since Apr 14th, 2026 at 0.02256613
The short-term trend has been DOWN since Apr 14th, 2026 at 0.02256613
Smart Scan Analysis for USDCLF
Based on our trend formula, USDCLF is rated as a -100 on a scale from -100 (Strong Downtrend) to +100 (Strong Uptrend).
| Open | High | Low | Price | Change |
|---|---|---|---|---|
| 0.02275034 | 0.02275034 | 0.02252446 | 0.02252751 | -0.00022300 |
| Prev. Close | Volume | Bid | Ask | Time |
| 0.02275034 | 2026-04-14 17:42:22 |