Forex Trend Analysis Report
Prepared for you on Wednesday, March 25, 2026.
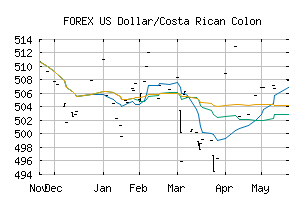
US Dollar/Costa Rican Colon (FOREX:USDCRC)
Strong Downtrend (-100) - USDCRC is in a strong downtrend that is likely to continue. With short-term, intermediate, and long-term bearish momentum, USDCRC continues to fall. Traders should use caution and set stops.
Is it time to buy, sell, or avoid USDCRC?
MarketClub looks at technical strength and momentum to determine if the timing is right for USDCRC.
Learn more about the Trade Triangles and how we make technical analysis as easy as buy and sell.
|
|||||||||||||||
|
|||||||||||||||
MarketClub’s Trade Triangles for USDCRC
![]() The long-term trend has been DOWN since Aug 1st, 2025 at 502.60371
The long-term trend has been DOWN since Aug 1st, 2025 at 502.60371
![]() The intermediate-term trend has been DOWN since Feb 17th, 2026 at 491.10200
The intermediate-term trend has been DOWN since Feb 17th, 2026 at 491.10200
![]() The short-term trend has been DOWN since Feb 17th, 2026 at 492.76897
The short-term trend has been DOWN since Feb 17th, 2026 at 492.76897
Smart Scan Analysis for USDCRC
Based on our trend formula, USDCRC is rated as a -100 on a scale from -100 (Strong Downtrend) to +100 (Strong Uptrend).
| Open | High | Low | Price | Change |
|---|---|---|---|---|
| 466.28995 | 466.28995 | 466.28995 | 466.28995 | 0.00000 |
| Prev. Close | Volume | Bid | Ask | Time |
| 465.05820 | 2026-03-21 04:10:11 |