Forex Trend Analysis Report
Prepared for you on Tuesday, April 14, 2026.
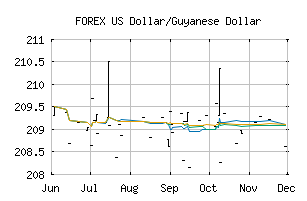
US Dollar/Guyanese Dollar (FOREX:USDGYD)
Countertrend Up (+85) - USDGYD is showing short-term weakness. However, look for the longer-term bullish trend to resume. As always, continue to monitor the trend score and utilize a stop order.
Is it time to buy, sell, or avoid USDGYD?
MarketClub looks at technical strength and momentum to determine if the timing is right for USDGYD.
Learn more about the Trade Triangles and how we make technical analysis as easy as buy and sell.
|
|||||||||||||||
|
|||||||||||||||
MarketClub’s Trade Triangles for USDGYD
![]() The long-term trend has been UP since Jan 30th, 2026 at 210.35233
The long-term trend has been UP since Jan 30th, 2026 at 210.35233
![]() The intermediate-term trend has been UP since Apr 13th, 2026 at 209.07937
The intermediate-term trend has been UP since Apr 13th, 2026 at 209.07937
![]() The short-term trend has been UP since Apr 13th, 2026 at 209.07937
The short-term trend has been UP since Apr 13th, 2026 at 209.07937
Smart Scan Analysis for USDGYD
Based on our trend formula, USDGYD is rated as a +80 on a scale from -100 (Strong Downtrend) to +100 (Strong Uptrend).
| Open | High | Low | Price | Change |
|---|---|---|---|---|
| 209.12491 | 209.12491 | 209.12491 | 209.12491 | 0.00000 |
| Prev. Close | Volume | Bid | Ask | Time |
| 209.15836 | 2026-04-13 07:26:58 |