Forex Trend Analysis Report
Prepared for you on Tuesday, April 14, 2026.
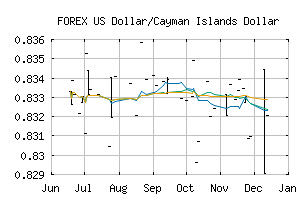
US Dollar/Cayman Islands Dollar (FOREX:USDKYD)
Crossroads (-60) - USDKYD is struggling to move into a solid trend. Beware of choppy markets and consider a sidelines position until a stronger trend is identified.
Is it time to buy, sell, or avoid USDKYD?
MarketClub looks at technical strength and momentum to determine if the timing is right for USDKYD.
Learn more about the Trade Triangles and how we make technical analysis as easy as buy and sell.
|
|||||||||||||||
|
|||||||||||||||
MarketClub’s Trade Triangles for USDKYD
![]() The long-term trend has been UP since Feb 1st, 2026 at 0.8344262
The long-term trend has been UP since Feb 1st, 2026 at 0.8344262
![]() The intermediate-term trend has been DOWN since Mar 17th, 2026 at 0.8314750
The intermediate-term trend has been DOWN since Mar 17th, 2026 at 0.8314750
![]() The short-term trend has been DOWN since Apr 10th, 2026 at 0.8332292
The short-term trend has been DOWN since Apr 10th, 2026 at 0.8332292
Smart Scan Analysis for USDKYD
Based on our trend formula, USDKYD is rated as a -60 on a scale from -100 (Strong Downtrend) to +100 (Strong Uptrend).
| Open | High | Low | Price | Change |
|---|---|---|---|---|
| 0.832995 | 0.832995 | 0.832995 | 0.832995 | 0.000000 |
| Prev. Close | Volume | Bid | Ask | Time |
| 0.833125 | 2026-04-13 07:26:59 |