Forex Trend Analysis Report
Prepared for you on Wednesday, March 25, 2026.
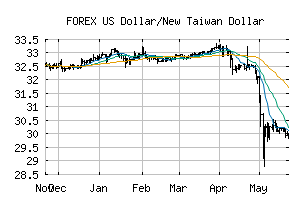
US Dollar/New Taiwan Dollar (FOREX:USDTWD)
Strong Uptrend (+100) - USDTWD is in a strong uptrend that is likely to continue. With short-term, intermediate, and long-term bullish momentum, USDTWD continues to climb. Traders should protect gains and look for a change in score to suggest a slow down in momentum.
Is it time to buy, sell, or avoid USDTWD?
MarketClub looks at technical strength and momentum to determine if the timing is right for USDTWD.
Learn more about the Trade Triangles and how we make technical analysis as easy as buy and sell.
|
|||||||||||||||
|
|||||||||||||||
MarketClub’s Trade Triangles for USDTWD
![]() The long-term trend has been UP since Aug 4th, 2025 at 32.1455
The long-term trend has been UP since Aug 4th, 2025 at 32.1455
![]() The intermediate-term trend has been UP since Mar 2nd, 2026 at 31.6570
The intermediate-term trend has been UP since Mar 2nd, 2026 at 31.6570
![]() The short-term trend has been UP since Mar 22nd, 2026 at 32.0720
The short-term trend has been UP since Mar 22nd, 2026 at 32.0720
Smart Scan Analysis for USDTWD
Based on our trend formula, USDTWD is rated as a +100 on a scale from -100 (Strong Downtrend) to +100 (Strong Uptrend).
| Open | High | Low | Price | Change |
|---|---|---|---|---|
| 31.9360 | 32.0033 | 31.8810 | 31.9508 | +0.0148 |
| Prev. Close | Volume | Bid | Ask | Time |
| 31.9360 | 2026-03-25 18:28:27 |