Forex Trend Analysis Report
Prepared for you on Tuesday, March 31, 2026.
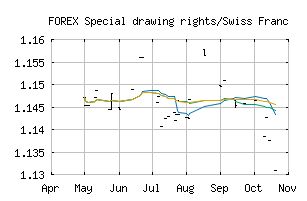
Special drawing rights/Swiss Franc (FOREX:XDRCHF)
Sidelines Mode (+50) - XDRCHF is failing to move into a strong trend and is encountering choppy trading conditions. Be cautious and consider taking a sidelines position until XDRCHF can gain momentum.
Is it time to buy, sell, or avoid XDRCHF?
MarketClub looks at technical strength and momentum to determine if the timing is right for XDRCHF.
Learn more about the Trade Triangles and how we make technical analysis as easy as buy and sell.
|
|||||||||||||||
|
|||||||||||||||
MarketClub’s Trade Triangles for XDRCHF
![]() The long-term trend has been DOWN since Oct 10th, 2025 at 1.1407330
The long-term trend has been DOWN since Oct 10th, 2025 at 1.1407330
![]() The intermediate-term trend has been UP since Mar 22nd, 2026 at 1.1111976
The intermediate-term trend has been UP since Mar 22nd, 2026 at 1.1111976
![]() The short-term trend has been UP since Mar 26th, 2026 at 1.1166095
The short-term trend has been UP since Mar 26th, 2026 at 1.1166095
Smart Scan Analysis for XDRCHF
Based on our trend formula, XDRCHF is rated as a +50 on a scale from -100 (Strong Downtrend) to +100 (Strong Uptrend).
| Open | High | Low | Price | Change |
|---|---|---|---|---|
| 1.1237313 | 1.1237313 | 1.1237313 | 1.1237313 | 0.0000000 |
| Prev. Close | Volume | Bid | Ask | Time |
| 1.1248468 | 2026-03-26 18:17:32 |