Forex Trend Analysis Report
Prepared for you on Wednesday, March 25, 2026.
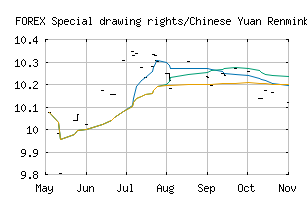
Special drawing rights/Chinese Yuan Renminbi (FOREX:XDRCNY)
Long-Term Downtrend (-90) - XDRCNY is in a strong downtrend that is likely to continue. While XDRCNY is showing intraday strength, it remains in the confines of a bearish trend. Traders should use caution and set stops.
Is it time to buy, sell, or avoid XDRCNY?
MarketClub looks at technical strength and momentum to determine if the timing is right for XDRCNY.
Learn more about the Trade Triangles and how we make technical analysis as easy as buy and sell.
|
|||||||||||||||
|
|||||||||||||||
MarketClub’s Trade Triangles for XDRCNY
![]() The long-term trend has been DOWN since Oct 10th, 2025 at 10.183006
The long-term trend has been DOWN since Oct 10th, 2025 at 10.183006
![]() The intermediate-term trend has been DOWN since Feb 18th, 2026 at 10.057585
The intermediate-term trend has been DOWN since Feb 18th, 2026 at 10.057585
![]() The short-term trend has been DOWN since Feb 18th, 2026 at 10.057585
The short-term trend has been DOWN since Feb 18th, 2026 at 10.057585
Smart Scan Analysis for XDRCNY
Based on our trend formula, XDRCNY is rated as a -90 on a scale from -100 (Strong Downtrend) to +100 (Strong Uptrend).
| Open | High | Low | Price | Change |
|---|---|---|---|---|
| 9.752622 | 9.752622 | 9.752622 | 9.752622 | 0.000000 |
| Prev. Close | Volume | Bid | Ask | Time |
| 9.810510 | 2026-03-22 22:06:29 |