Forex Trend Analysis Report
Prepared for you on Wednesday, March 25, 2026.
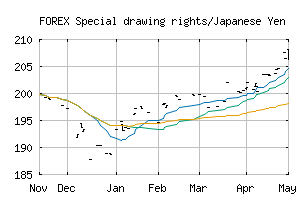
Special drawing rights/Japanese Yen (FOREX:XDRJPY)
Weak Uptrend (+65) - XDRJPY is showing signs of weakening momentum to the upside. Monitor XDRJPY as it may be in the beginning stages of a reversal.
Is it time to buy, sell, or avoid XDRJPY?
MarketClub looks at technical strength and momentum to determine if the timing is right for XDRJPY.
Learn more about the Trade Triangles and how we make technical analysis as easy as buy and sell.
|
|||||||||||||||
|
|||||||||||||||
MarketClub’s Trade Triangles for XDRJPY
![]() The long-term trend has been UP since Jun 13th, 2025 at 201.22273
The long-term trend has been UP since Jun 13th, 2025 at 201.22273
![]() The intermediate-term trend has been UP since Mar 22nd, 2026 at 224.77815
The intermediate-term trend has been UP since Mar 22nd, 2026 at 224.77815
![]() The short-term trend has been DOWN since Feb 18th, 2026 at 224.62797
The short-term trend has been DOWN since Feb 18th, 2026 at 224.62797
Smart Scan Analysis for XDRJPY
Based on our trend formula, XDRJPY is rated as a +65 on a scale from -100 (Strong Downtrend) to +100 (Strong Uptrend).
| Open | High | Low | Price | Change |
|---|---|---|---|---|
| 225.87092 | 225.87092 | 225.87092 | 225.87092 | 0.00000 |
| Prev. Close | Volume | Bid | Ask | Time |
| 225.87828 | 2026-03-22 22:06:29 |