Forex Trend Analysis Report
Prepared for you on Tuesday, April 14, 2026.
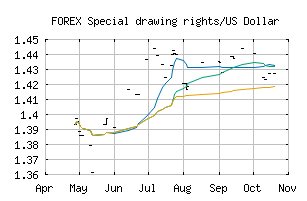
Special drawing rights/US Dollar (FOREX:XDRUSD)
Sidelines Mode (+50) - XDRUSD is failing to move into a strong trend and is encountering choppy trading conditions. Be cautious and consider taking a sidelines position until XDRUSD can gain momentum.
Is it time to buy, sell, or avoid XDRUSD?
MarketClub looks at technical strength and momentum to determine if the timing is right for XDRUSD.
Learn more about the Trade Triangles and how we make technical analysis as easy as buy and sell.
|
|||||||||||||||
|
|||||||||||||||
MarketClub’s Trade Triangles for XDRUSD
![]() The long-term trend has been DOWN since Mar 16th, 2026 at 1.4225913
The long-term trend has been DOWN since Mar 16th, 2026 at 1.4225913
![]() The intermediate-term trend has been UP since Apr 7th, 2026 at 1.4162724
The intermediate-term trend has been UP since Apr 7th, 2026 at 1.4162724
![]() The short-term trend has been UP since Apr 7th, 2026 at 1.4143479
The short-term trend has been UP since Apr 7th, 2026 at 1.4143479
Smart Scan Analysis for XDRUSD
Based on our trend formula, XDRUSD is rated as a +50 on a scale from -100 (Strong Downtrend) to +100 (Strong Uptrend).
| Open | High | Low | Price | Change |
|---|---|---|---|---|
| 1.4379137 | 1.4379137 | 1.4379137 | 1.4379137 | 0.0000000 |
| Prev. Close | Volume | Bid | Ask | Time |
| 1.4449497 | 2026-04-12 07:24:50 |