Forex Trend Analysis Report
Prepared for you on Friday, April 3, 2026.
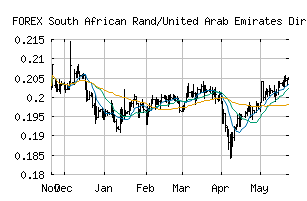
South African Rand/United Arab Emirates Dirham (FOREX:ZARAED)
Countertrend Down (-85) - ZARAED is showing short-term strength. However, look for the longer-term bearish trend to resume. As always, continue to monitor the trend score and set stops.
Is it time to buy, sell, or avoid ZARAED?
MarketClub looks at technical strength and momentum to determine if the timing is right for ZARAED.
Learn more about the Trade Triangles and how we make technical analysis as easy as buy and sell.
|
|||||||||||||||
|
|||||||||||||||
MarketClub’s Trade Triangles for ZARAED
![]() The long-term trend has been DOWN since Mar 23rd, 2026 at 0.21396903
The long-term trend has been DOWN since Mar 23rd, 2026 at 0.21396903
![]() The intermediate-term trend has been DOWN since Mar 3rd, 2026 at 0.22638609
The intermediate-term trend has been DOWN since Mar 3rd, 2026 at 0.22638609
![]() The short-term trend has been UP since Mar 31st, 2026 at 0.21587450
The short-term trend has been UP since Mar 31st, 2026 at 0.21587450
Smart Scan Analysis for ZARAED
Based on our trend formula, ZARAED is rated as a -85 on a scale from -100 (Strong Downtrend) to +100 (Strong Uptrend).
| Open | High | Low | Price | Change |
|---|---|---|---|---|
| 0.21682893 | 0.21682893 | 0.21656831 | 0.21666428 | -0.00016500 |
| Prev. Close | Volume | Bid | Ask | Time |
| 0.21682893 | 2026-04-03 02:25:16 |