Forex Trend Analysis Report
Prepared for you on Wednesday, March 25, 2026.
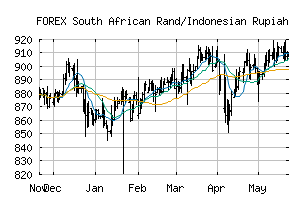
South African Rand/Indonesian Rupiah (FOREX:ZARIDR)
Weak Downtrend (-65) - ZARIDR is showing signs of a strengthening downtrend. Monitor ZARIDR as it may be building momentum to the downside.
Is it time to buy, sell, or avoid ZARIDR?
MarketClub looks at technical strength and momentum to determine if the timing is right for ZARIDR.
Learn more about the Trade Triangles and how we make technical analysis as easy as buy and sell.
|
|||||||||||||||
|
|||||||||||||||
MarketClub’s Trade Triangles for ZARIDR
![]() The long-term trend has been UP since Mar 11th, 2025 at 905.8561
The long-term trend has been UP since Mar 11th, 2025 at 905.8561
![]() The intermediate-term trend has been DOWN since Mar 2nd, 2026 at 1042.3338
The intermediate-term trend has been DOWN since Mar 2nd, 2026 at 1042.3338
![]() The short-term trend has been DOWN since Mar 23rd, 2026 at 988.6754
The short-term trend has been DOWN since Mar 23rd, 2026 at 988.6754
Smart Scan Analysis for ZARIDR
Based on our trend formula, ZARIDR is rated as a -70 on a scale from -100 (Strong Downtrend) to +100 (Strong Uptrend).
| Open | High | Low | Price | Change |
|---|---|---|---|---|
| 996.9991 | 1002.4228 | 991.8726 | 992.6966 | -4.3025 |
| Prev. Close | Volume | Bid | Ask | Time |
| 996.9991 | 2026-03-25 17:01:33 |