Forex Trend Analysis Report
Prepared for you on Saturday, April 4, 2026.
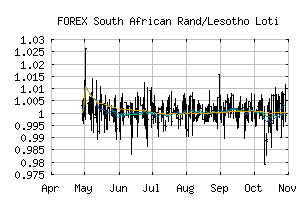
South African Rand/Lesotho Loti (FOREX:ZARLSL)
Weak Downtrend (-65) - ZARLSL is showing signs of a strengthening downtrend. Monitor ZARLSL as it may be building momentum to the downside.
Is it time to buy, sell, or avoid ZARLSL?
MarketClub looks at technical strength and momentum to determine if the timing is right for ZARLSL.
Learn more about the Trade Triangles and how we make technical analysis as easy as buy and sell.
|
|||||||||||||||
|
|||||||||||||||
MarketClub’s Trade Triangles for ZARLSL
![]() The long-term trend has been DOWN since Mar 3rd, 2026 at 0.9818156
The long-term trend has been DOWN since Mar 3rd, 2026 at 0.9818156
![]() The intermediate-term trend has been DOWN since Mar 1st, 2026 at 0.9894974
The intermediate-term trend has been DOWN since Mar 1st, 2026 at 0.9894974
![]() The short-term trend has been DOWN since Apr 1st, 2026 at 0.9963888
The short-term trend has been DOWN since Apr 1st, 2026 at 0.9963888
Smart Scan Analysis for ZARLSL
Based on our trend formula, ZARLSL is rated as a -70 on a scale from -100 (Strong Downtrend) to +100 (Strong Uptrend).
| Open | High | Low | Price | Change |
|---|---|---|---|---|
| 1.0025265 | 1.0025265 | 1.0025265 | 1.0025265 | 0.0000000 |
| Prev. Close | Volume | Bid | Ask | Time |
| 1.0025265 | 2026-04-04 12:25:10 |