Forex Trend Analysis Report
Prepared for you on Monday, March 30, 2026.
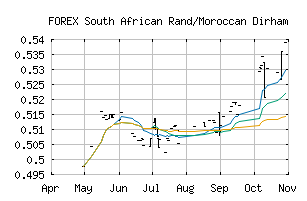
South African Rand/Moroccan Dirham (FOREX:ZARMAD)
Weak Downtrend (-65) - ZARMAD is showing signs of a strengthening downtrend. Monitor ZARMAD as it may be building momentum to the downside.
Is it time to buy, sell, or avoid ZARMAD?
MarketClub looks at technical strength and momentum to determine if the timing is right for ZARMAD.
Learn more about the Trade Triangles and how we make technical analysis as easy as buy and sell.
|
|||||||||||||||
|
|||||||||||||||
MarketClub’s Trade Triangles for ZARMAD
![]() The long-term trend has been UP since Sep 10th, 2025 at 0.51579133
The long-term trend has been UP since Sep 10th, 2025 at 0.51579133
![]() The intermediate-term trend has been DOWN since Mar 12th, 2026 at 0.56831607
The intermediate-term trend has been DOWN since Mar 12th, 2026 at 0.56831607
![]() The short-term trend has been DOWN since Mar 12th, 2026 at 0.57311687
The short-term trend has been DOWN since Mar 12th, 2026 at 0.57311687
Smart Scan Analysis for ZARMAD
Based on our trend formula, ZARMAD is rated as a -70 on a scale from -100 (Strong Downtrend) to +100 (Strong Uptrend).
| Open | High | Low | Price | Change |
|---|---|---|---|---|
| 0.54481773 | 0.54481773 | 0.54481773 | 0.54481773 | 0.00000000 |
| Prev. Close | Volume | Bid | Ask | Time |
| 0.54471466 | 2026-03-26 18:17:29 |