Forex Trend Analysis Report
Prepared for you on Wednesday, April 8, 2026.
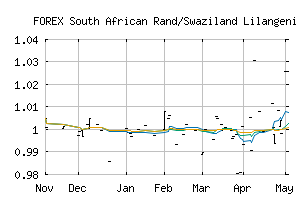
South African Rand/Swaziland Lilangeni (FOREX:ZARSZL)
Weak Downtrend (-65) - ZARSZL is showing signs of a strengthening downtrend. Monitor ZARSZL as it may be building momentum to the downside.
Is it time to buy, sell, or avoid ZARSZL?
MarketClub looks at technical strength and momentum to determine if the timing is right for ZARSZL.
Learn more about the Trade Triangles and how we make technical analysis as easy as buy and sell.
|
|||||||||||||||
|
|||||||||||||||
MarketClub’s Trade Triangles for ZARSZL
![]() The long-term trend has been DOWN since Mar 22nd, 2026 at 0.9948315
The long-term trend has been DOWN since Mar 22nd, 2026 at 0.9948315
![]() The intermediate-term trend has been UP since Apr 1st, 2026 at 0.9978534
The intermediate-term trend has been UP since Apr 1st, 2026 at 0.9978534
![]() The short-term trend has been DOWN since Feb 25th, 2026 at 1.0000399
The short-term trend has been DOWN since Feb 25th, 2026 at 1.0000399
Smart Scan Analysis for ZARSZL
Based on our trend formula, ZARSZL is rated as a -65 on a scale from -100 (Strong Downtrend) to +100 (Strong Uptrend).
| Open | High | Low | Price | Change |
|---|---|---|---|---|
| 0.9990043 | 0.9990043 | 0.9990043 | 0.9990043 | 0.0000000 |
| Prev. Close | Volume | Bid | Ask | Time |
| 0.9990043 | 2026-04-02 07:26:02 |