Index Trend Analysis Report
Prepared for you on Tuesday, April 30, 2024.
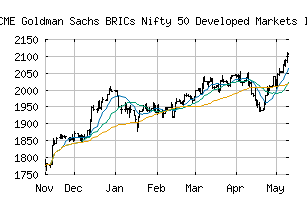
Goldman Sachs BRICs Nifty 50 Developed Markets Index (CME:N50DMPR)
Weak Uptrend (+65) - N50DMPR is showing signs of weakening momentum to the upside. Monitor N50DMPR as it may be in the beginning stages of a reversal.
Is it time to buy, sell, or avoid N50DMPR?
MarketClub looks at technical strength and momentum to determine if the timing is right for N50DMPR.
Learn more about the Trade Triangles and how we make technical analysis as easy as buy and sell.
|
|||||||||||||||
|
|||||||||||||||
MarketClub’s Trade Triangles for N50DMPR
![]() The long-term trend has been UP since Dec 14th, 2023 at 1932.37
The long-term trend has been UP since Dec 14th, 2023 at 1932.37
![]() The intermediate-term trend has been DOWN since Apr 12th, 2024 at 1992.78
The intermediate-term trend has been DOWN since Apr 12th, 2024 at 1992.78
![]() The short-term trend has been UP since Apr 23rd, 2024 at 1963.99
The short-term trend has been UP since Apr 23rd, 2024 at 1963.99
Smart Scan Analysis for N50DMPR
Based on our trend formula, N50DMPR is rated as a +65 on a scale from -100 (Strong Downtrend) to +100 (Strong Uptrend).
| Open | High | Low | Price | Change |
|---|---|---|---|---|
| 2039.76 | 2040.27 | 2010.90 | 2012.29 | -27.24 |
| Prev. Close | Volume | Bid | Ask | Time |
| 2039.53 | 0 | 2024-04-30 21:54:15 |
| 52wk High | 1789.5 | 52wk High Date | 2018-01-23 |
| 52wk Low | 1403.72 | 52wk Low Date | 2018-10-29 |