Index Trend Analysis Report
Prepared for you on Thursday, March 26, 2026.
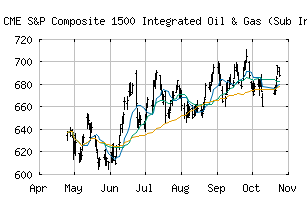
S&P Composite 1500 Integrated Oil & Gas (Sub Ind) (CME:SP1500-10102010)
Long-Term Uptrend (+90) - SP1500-10102010 is in a strong uptrend that is likely to continue. While SP1500-10102010 is showing intraday weakness, it remains in the confines of a bullish trend. Traders should use caution and utilize a stop order.
Is it time to buy, sell, or avoid SP1500-10102010?
MarketClub looks at technical strength and momentum to determine if the timing is right for SP1500-10102010.
Learn more about the Trade Triangles and how we make technical analysis as easy as buy and sell.
|
|||||||||||||||
|
|||||||||||||||
MarketClub’s Trade Triangles for SP1500-10102010
![]() The long-term trend has been UP since Aug 29th, 2025 at 692.83
The long-term trend has been UP since Aug 29th, 2025 at 692.83
![]() The intermediate-term trend has been UP since Dec 29th, 2025 at 699.06
The intermediate-term trend has been UP since Dec 29th, 2025 at 699.06
![]() The short-term trend has been UP since Mar 24th, 2026 at 946.04
The short-term trend has been UP since Mar 24th, 2026 at 946.04
Smart Scan Analysis for SP1500-10102010
Based on our trend formula, SP1500-10102010 is rated as a +90 on a scale from -100 (Strong Downtrend) to +100 (Strong Uptrend).
| Open | High | Low | Price | Change |
|---|---|---|---|---|
| 957.16 | 958.63 | 948.58 | 950.34 | -9.84 |
| Prev. Close | Volume | Bid | Ask | Time |
| 950.34 | 39880319 | 2026-03-25 16:19:27 |
| 52wk High | 579.74 | 52wk High Date | 2018-01-24 |
| 52wk Low | 475.2 | 52wk Low Date | 2018-04-02 |