Index Trend Analysis Report
Prepared for you on Saturday, March 28, 2026.
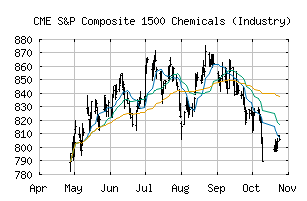
S&P Composite 1500 Chemicals (Industry) (CME:SP1500-151010)
Weak Uptrend (+65) - SP1500-151010 is showing signs of weakening momentum to the upside. Monitor SP1500-151010 as it may be in the beginning stages of a reversal.
Is it time to buy, sell, or avoid SP1500-151010?
MarketClub looks at technical strength and momentum to determine if the timing is right for SP1500-151010.
Learn more about the Trade Triangles and how we make technical analysis as easy as buy and sell.
|
|||||||||||||||
|
|||||||||||||||
MarketClub’s Trade Triangles for SP1500-151010
![]() The long-term trend has been UP since Jan 9th, 2026 at 829.42
The long-term trend has been UP since Jan 9th, 2026 at 829.42
![]() The intermediate-term trend has been DOWN since Mar 9th, 2026 at 876.55
The intermediate-term trend has been DOWN since Mar 9th, 2026 at 876.55
![]() The short-term trend has been UP since Mar 24th, 2026 at 884.60
The short-term trend has been UP since Mar 24th, 2026 at 884.60
Smart Scan Analysis for SP1500-151010
Based on our trend formula, SP1500-151010 is rated as a +65 on a scale from -100 (Strong Downtrend) to +100 (Strong Uptrend).
| Open | High | Low | Price | Change |
|---|---|---|---|---|
| 909.47 | 911.40 | 903.22 | 905.57 | -3.04 |
| Prev. Close | Volume | Bid | Ask | Time |
| 905.57 | 78353327 | 2026-03-27 16:34:13 |
| 52wk High | 651.15 | 52wk High Date | 2018-01-25 |
| 52wk Low | 482.03 | 52wk Low Date | 2017-12-06 |