Index Trend Analysis Report
Prepared for you on Wednesday, April 8, 2026.
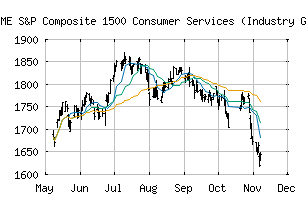
S&P Composite 1500 Consumer Services (Industry Group) (CME:SP1500-2530)
Bull Market Weakness (+75) - SP1500-2530 is showing signs of short-term weakness, but still remains in the confines of a long-term uptrend. Keep an eye on SP1500-2530 as it may be in the beginning stages of a reversal.
Is it time to buy, sell, or avoid SP1500-2530?
MarketClub looks at technical strength and momentum to determine if the timing is right for SP1500-2530.
Learn more about the Trade Triangles and how we make technical analysis as easy as buy and sell.
|
|||||||||||||||
|
|||||||||||||||
MarketClub’s Trade Triangles for SP1500-2530
![]() The long-term trend has been DOWN since Mar 9th, 2026 at 1666.18
The long-term trend has been DOWN since Mar 9th, 2026 at 1666.18
![]() The intermediate-term trend has been UP since Apr 8th, 2026 at 1716.41
The intermediate-term trend has been UP since Apr 8th, 2026 at 1716.41
![]() The short-term trend has been UP since Apr 1st, 2026 at 1639.30
The short-term trend has been UP since Apr 1st, 2026 at 1639.30
Smart Scan Analysis for SP1500-2530
Based on our trend formula, SP1500-2530 is rated as a +70 on a scale from -100 (Strong Downtrend) to +100 (Strong Uptrend).
| Open | High | Low | Price | Change |
|---|---|---|---|---|
| 1706.42 | 1725.74 | 1694.85 | 1697.31 | +55.17 |
| Prev. Close | Volume | Bid | Ask | Time |
| 1642.14 | 95447239 | 2026-04-08 12:00:27 |
| 52wk High | 1012.34 | 52wk High Date | 2018-01-24 |
| 52wk Low | 891.07 | 52wk Low Date | 2018-06-28 |