Index Trend Analysis Report
Prepared for you on Wednesday, March 25, 2026.
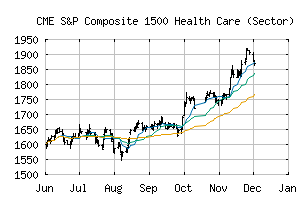
S&P Composite 1500 Health Care (Sector) (CME:SP1500-35)
Strong Downtrend (-100) - SP1500-35 is in a strong downtrend that is likely to continue. With short-term, intermediate, and long-term bearish momentum, SP1500-35 continues to fall. Traders should use caution and set stops.
Is it time to buy, sell, or avoid SP1500-35?
MarketClub looks at technical strength and momentum to determine if the timing is right for SP1500-35.
Learn more about the Trade Triangles and how we make technical analysis as easy as buy and sell.
|
|||||||||||||||
|
|||||||||||||||
MarketClub’s Trade Triangles for SP1500-35
![]() The long-term trend has been DOWN since Mar 12th, 2026 at 1812.57
The long-term trend has been DOWN since Mar 12th, 2026 at 1812.57
![]() The intermediate-term trend has been DOWN since Mar 5th, 2026 at 1863.63
The intermediate-term trend has been DOWN since Mar 5th, 2026 at 1863.63
![]() The short-term trend has been DOWN since Mar 3rd, 2026 at 1881.52
The short-term trend has been DOWN since Mar 3rd, 2026 at 1881.52
Smart Scan Analysis for SP1500-35
Based on our trend formula, SP1500-35 is rated as a -100 on a scale from -100 (Strong Downtrend) to +100 (Strong Uptrend).
| Open | High | Low | Price | Change |
|---|---|---|---|---|
| 1766.50 | 1775.51 | 1760.09 | 1771.20 | +17.98 |
| Prev. Close | Volume | Bid | Ask | Time |
| 1753.22 | 406663088 | 2026-03-25 16:19:14 |
| 52wk High | 1180.24 | 52wk High Date | 2018-10-01 |
| 52wk Low | 963.48 | 52wk Low Date | 2018-04-02 |