Index Trend Analysis Report
Prepared for you on Wednesday, February 5, 2025.
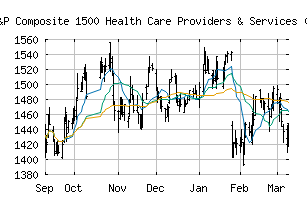
S&P Composite 1500 Health Care Providers & Services (Industry) (CME:SP1500-351020)
Sidelines Mode (-55) - SP1500-351020 is moving in a sideways pattern and is unable to gain momentum in either direction. Beware of choppy movement and consider a sidelines position until a stronger trend is identified.
Is it time to buy, sell, or avoid SP1500-351020?
MarketClub looks at technical strength and momentum to determine if the timing is right for SP1500-351020.
Learn more about the Trade Triangles and how we make technical analysis as easy as buy and sell.
|
|||||||||||||||
|
|||||||||||||||
MarketClub’s Trade Triangles for SP1500-351020
![]() The long-term trend has been DOWN since Nov 5th, 2024 at 1637.99
The long-term trend has been DOWN since Nov 5th, 2024 at 1637.99
![]() The intermediate-term trend has been UP since Jan 10th, 2025 at 1564.03
The intermediate-term trend has been UP since Jan 10th, 2025 at 1564.03
![]() The short-term trend has been DOWN since Feb 5th, 2025 at 1634.72
The short-term trend has been DOWN since Feb 5th, 2025 at 1634.72
Smart Scan Analysis for SP1500-351020
Based on our trend formula, SP1500-351020 is rated as a -55 on a scale from -100 (Strong Downtrend) to +100 (Strong Uptrend).
| Open | High | Low | Price | Change |
|---|---|---|---|---|
| 1635.30 | 1641.88 | 1622.60 | 1629.42 | -21.58 |
| Prev. Close | Volume | Bid | Ask | Time |
| 1651.00 | 22453131 | 2025-02-05 11:34:42 |
| 52wk High | 1021.84 | 52wk High Date | 2018-11-29 |
| 52wk Low | 802.37 | 52wk Low Date | 2018-04-02 |